
Think of your retail business like a car. You wouldn’t drive it without a dashboard. You need the speedometer, the fuel gauge, and the engine temperature light to know what’s happening. Key performance indicators, or KPIs, are the dashboard for your business.
They are the specific, measurable data points that give you a picture of your store’s health across sales, inventory, and customer happiness.
Understanding Your Retail Business Health
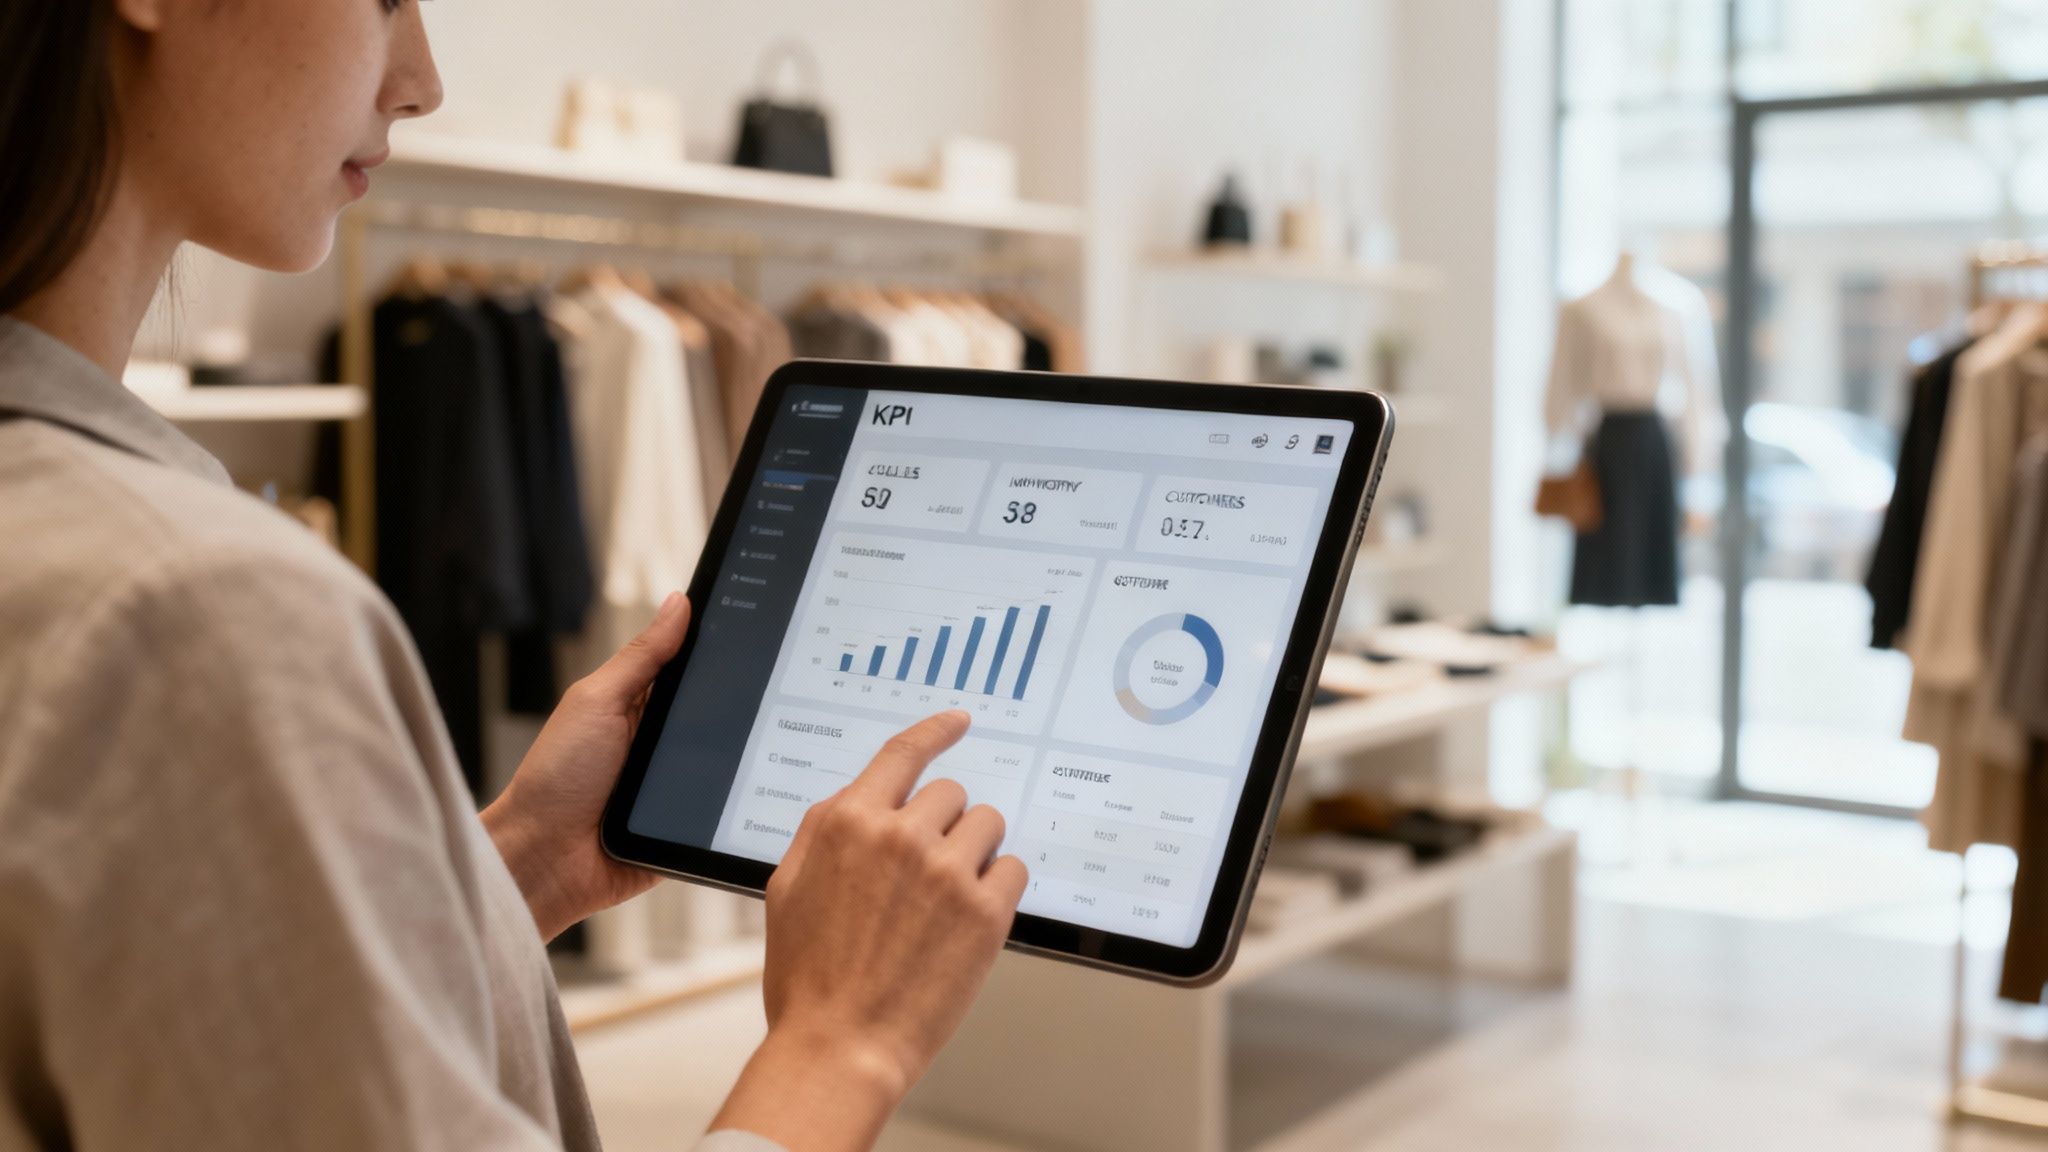
Running a retail store means juggling many things at once, from what’s on the shelves to who’s walking through the door. If you’re just going on gut feelings, you’re driving blind. This is where key performance indicators (KPIs) come in. They swap guesswork for facts.
These metrics give you an honest look at your operation. By tracking the right numbers, you can spot problems before they become headaches and uncover growth opportunities you might have otherwise missed.
Why Tracking KPIs Is Essential
Keeping an eye on your performance indicators isn’t just about running reports for the sake of it. In a competitive market, it’s about survival. When you consistently measure your business, you establish a baseline—a “normal” for your operations. This baseline helps you figure out what’s working and what needs attention.
KPIs are the bridge between raw data and real-world results. For example, a drop in your conversion rate might tell you it’s time for staff training. A low inventory turnover could point to issues with your product mix. These numbers tell a story and guide your strategy.
Think of KPIs as the language of retail performance. They translate abstract data into tangible insights, helping you make decisions that directly boost your bottom line.
Core Categories of Retail Metrics
Retail KPIs generally fall into a few core categories, each shining a light on a different part of your business. Grouping them this way helps you organize your thinking and get a complete picture of your store’s health.
Here are the key areas you should be measuring:
- Sales Metrics: These track everything related to revenue and transactions. They answer the questions: How much are we selling, and are we making a profit on it?
- Inventory Metrics: This is all about how well you manage your stock. These KPIs help you walk that line between having too much on hand and running out of items—both of which cost you money.
- Customer Metrics: These numbers gauge customer happiness and loyalty. They’re critical for building a business that keeps people coming back.
- Operations Metrics: This group looks at the efficiency of your store and your team. The metrics here can uncover ways to cut costs and improve day-to-day productivity.
Tracking Essential Sales and Financial KPIs
https://www.youtube.com/embed/1OdaQxlrqmQ
If you think of your retail business as a car, sales and financial KPIs are the gauges on your dashboard. They’re the engine, telling you how much revenue you’re generating and, more importantly, how profitable you are. These numbers are the most direct measure of your business’s health.
Keeping an eye on these metrics reveals how well your investment in inventory is turning into profit. They aren’t just figures on a spreadsheet; they’re signals that should guide your moves, from pricing and merchandising to your next marketing push. A low number might tell you it’s time for staff training, while a high one could be the green light you needed on a promotion.
Let’s dive into some of the most critical KPIs that every retailer should have on their radar.
Core Sales and Financial KPIs
This table breaks down the sales and financial metrics. Think of it as a reference guide to understanding what these numbers mean, how to calculate them, and what they reveal about the health of your business.
| KPI | Formula | What It Measures |
|---|---|---|
| Gross Margin Return on Investment (GMROI) | Gross Margin / Average Inventory Cost | The profit earned for every dollar invested in inventory. A higher number is better. |
| Average Transaction Value (ATV) | Total Revenue / Number of Transactions | The average amount a customer spends in a single purchase. Good for gauging upselling success. |
| Sales Per Square Foot | Total Net Sales / Total Selling Area (in sq. ft.) | The revenue generated for every square foot of sales space. Essential for physical stores. |
| Customer Lifetime Value (CLV) | Avg. Purchase Value x Avg. Purchase Frequency x Avg. Customer Lifespan | The total revenue you can expect from a single customer over their entire relationship with you. |
Each of these KPIs tells a story about your operations. Used together, they provide a comprehensive picture, helping you make data-driven decisions.
Gross Margin Return on Investment (GMROI)
Gross Margin Return on Investment, or GMROI, is one of the most powerful metrics in retail. It answers a question: “For every dollar I put into my inventory, how many dollars of gross margin am I getting back?”
The higher your GMROI, the more efficiently you’re turning stock into profit. It’s the test of how well you’re managing both your profit margins and your inventory levels.
GMROI = Gross Margin / Average Inventory Cost
Let’s say your store generated $150,000 in gross margin last year from an average inventory investment of $75,000. Your GMROI would be 2.0. That means you earned $2 in gross margin for every $1 tied up in inventory.
This single number can reveal differences between industries. According to The Retail Owners Institute, 2021 data showed that hardware stores had a GMROI of $1.77, while lumber and building material stores hit a higher $3.05—even though they often serve similar customers. You can learn more about retail performance metrics from industry analysis.
Average Transaction Value (ATV)
Your Average Transaction Value (ATV) is what it sounds like: the average amount a customer spends every time they make a purchase. It’s a metric that gives you feedback on customer spending habits and how effective your sales team is at upselling or cross-selling.
Boosting your ATV is one of the quickest ways to increase revenue without having to attract a new customer.
ATV = Total Revenue / Number of Transactions
Imagine your store brought in $10,000 yesterday from 250 separate transactions. Your ATV for the day would be $40. By tracking this daily or weekly, you can see the impact of things like staff training, product bundles, or a “buy one, get one” promotion.
Sales Per Square Foot
For anyone running a brick-and-mortar store, Sales per Square Foot is non-negotiable. This KPI measures the productivity of your physical space by calculating how much revenue each square foot of your sales floor generates. It’s the way to figure out which parts of your store are goldmines and which might need a rethink.
You divide your total sales by the total selling area of your store.
Sales per Square Foot = Total Net Sales / Total Selling Area (in sq. ft.)
If you have a 1,500-square-foot boutique that does $600,000 in annual sales, your Sales per Square Foot is $400. Is that good? Comparing it to industry benchmarks or even your own other locations will tell you what you need to know.
Customer Lifetime Value (CLV)
Customer Lifetime Value (CLV) is a forward-looking metric that predicts the total amount of money a customer is expected to spend at your business over the entire course of their relationship with you. It’s a reminder that keeping existing customers happy is often more valuable than chasing new ones.
A high CLV is a sign of customer loyalty and points to stable, long-term revenue.
CLV = Average Purchase Value x Average Purchase Frequency x Average Customer Lifespan
For example, if a customer spends an average of $50 per visit, comes in 6 times a year, and sticks with you for 5 years, their CLV is $1,500. Knowing this number makes it easier to justify spending money on loyalty programs and customer service—the things that keep those customers coming back.
Mastering Your Inventory and Operations KPIs

Think of your inventory as the lifeblood of your retail business. It’s your single biggest asset, but if you don’t manage it right, it can become your biggest liability.
It’s like stocking a pantry. Too much, and food spoils. Too little, and you can’t cook what your guests are craving. The trick is finding that balance, and that’s what your inventory and operations KPIs are for. They help you sidestep the mistakes of overstocking (which ties up cash) and understocking (which leads to lost sales).
Understanding Inventory Turnover Rate
First up is Inventory Turnover Rate. This metric tells you how many times you sell through your entire stock of goods in a given period, like a year or a quarter. It’s an indicator of how well you’re managing purchasing and how much demand there is for your products.
A high turnover rate usually means sales are moving. A low one, on the other hand, can be a red flag that your cash is stuck in products that aren’t moving.
The formula is simple:
Inventory Turnover = Cost of Goods Sold / Average Inventory Cost
Let’s say your Cost of Goods Sold for the year was $400,000, and you typically have about $50,000 worth of inventory on hand. Your turnover rate is 8. You sold and replaced your entire inventory eight times. A fast-fashion store might see a turnover rate over 10, while a furniture shop might be closer to 2 or 3. It all depends on your industry.
Measuring Sell-Through Rate
While turnover gives you the big picture, Sell-Through Rate zooms in on how a specific product is performing. It’s the percentage of units you sold out of the total you received from your supplier. This is your go-to metric for judging if a promotion worked, how seasonal items are doing, or if a new product is a hit.
Here’s how to calculate it:
Sell-Through Rate = (Number of Units Sold / Starting Inventory) x 100
Imagine you ordered 500 sweaters for the fall season and sold 400 of them. Your sell-through rate is 80%. That tells you the sweater was a winner and helps you make buying decisions next year. Keeping an eye on this is a cornerstone of any inventory management strategy.
Using the Stock-to-Sales Ratio
The Stock-to-Sales Ratio gives you a snapshot of your inventory levels at the start of the month versus the sales you made during that month. It helps answer a question: “Do I have the right amount of stuff on my shelves right now?”
The calculation is:
Stock-to-Sales Ratio = Beginning of Month Inventory Value / Sales for the Month
If you kicked off April with $60,000 in inventory and brought in $20,000 in sales, your ratio is 3:1. You had three times the inventory needed to cover that month’s sales. For some retailers, that’s perfect. For others, it might signal you’re overstocked.
Tracking and Reducing Shrinkage
Beyond just managing what you have, you also need to account for what you lose. Shrinkage is the inventory that vanishes for reasons other than a sale—think theft, administrative mistakes, or damaged goods. Every bit of it is a direct hit to your profit.
You can figure out your shrinkage with this formula:
Shrinkage = Ending Inventory Value – Actual Inventory Value
If your system says you should have $15,000 worth of product, but a physical count only turns up $14,200, you’ve lost $800 to shrinkage. The good news is you can fight back. Cycle counts, better security, and staff training are all proven ways to cut this number down and protect your bottom line.
Analyzing Customer Experience and Behavior KPIs
While sales and inventory numbers tell you what is happening in your store, customer experience KPIs explain why. These metrics get to the heart of how people feel about their interactions with your business, which is directly tied to loyalty and repeat purchases.
Getting a grip on these behaviors is key to building a retail operation that lasts. These numbers go beyond transaction data. They help you size up everything from the effectiveness of your store layout to your staff’s performance, all from the customer’s point of view. Track them right, and you can turn casual shoppers into dedicated fans.
Measuring Your Conversion Rate
The Conversion Rate is one of the most fundamental retail KPIs out there. It measures the percentage of people who walk into your store and buy something. Think of it as the test of your store’s ability to turn a browser into a buyer.
A ton of foot traffic is good, but if those visitors are leaving empty-handed, you have a problem. Focusing on improving your conversion rate is often a bigger win than just trying to get more people through the door. It’s about making the most of the opportunities you already have.
The formula is straightforward:
Conversion Rate = (Number of Sales / Number of Visitors) x 100
So, if 1,000 people visit your store in a day and you ring up 150 sales, your conversion rate is 15%. This single number tells you a story about how well your product displays, promotions, and staff are all working together to close the deal.
Gauging Customer Satisfaction and Loyalty
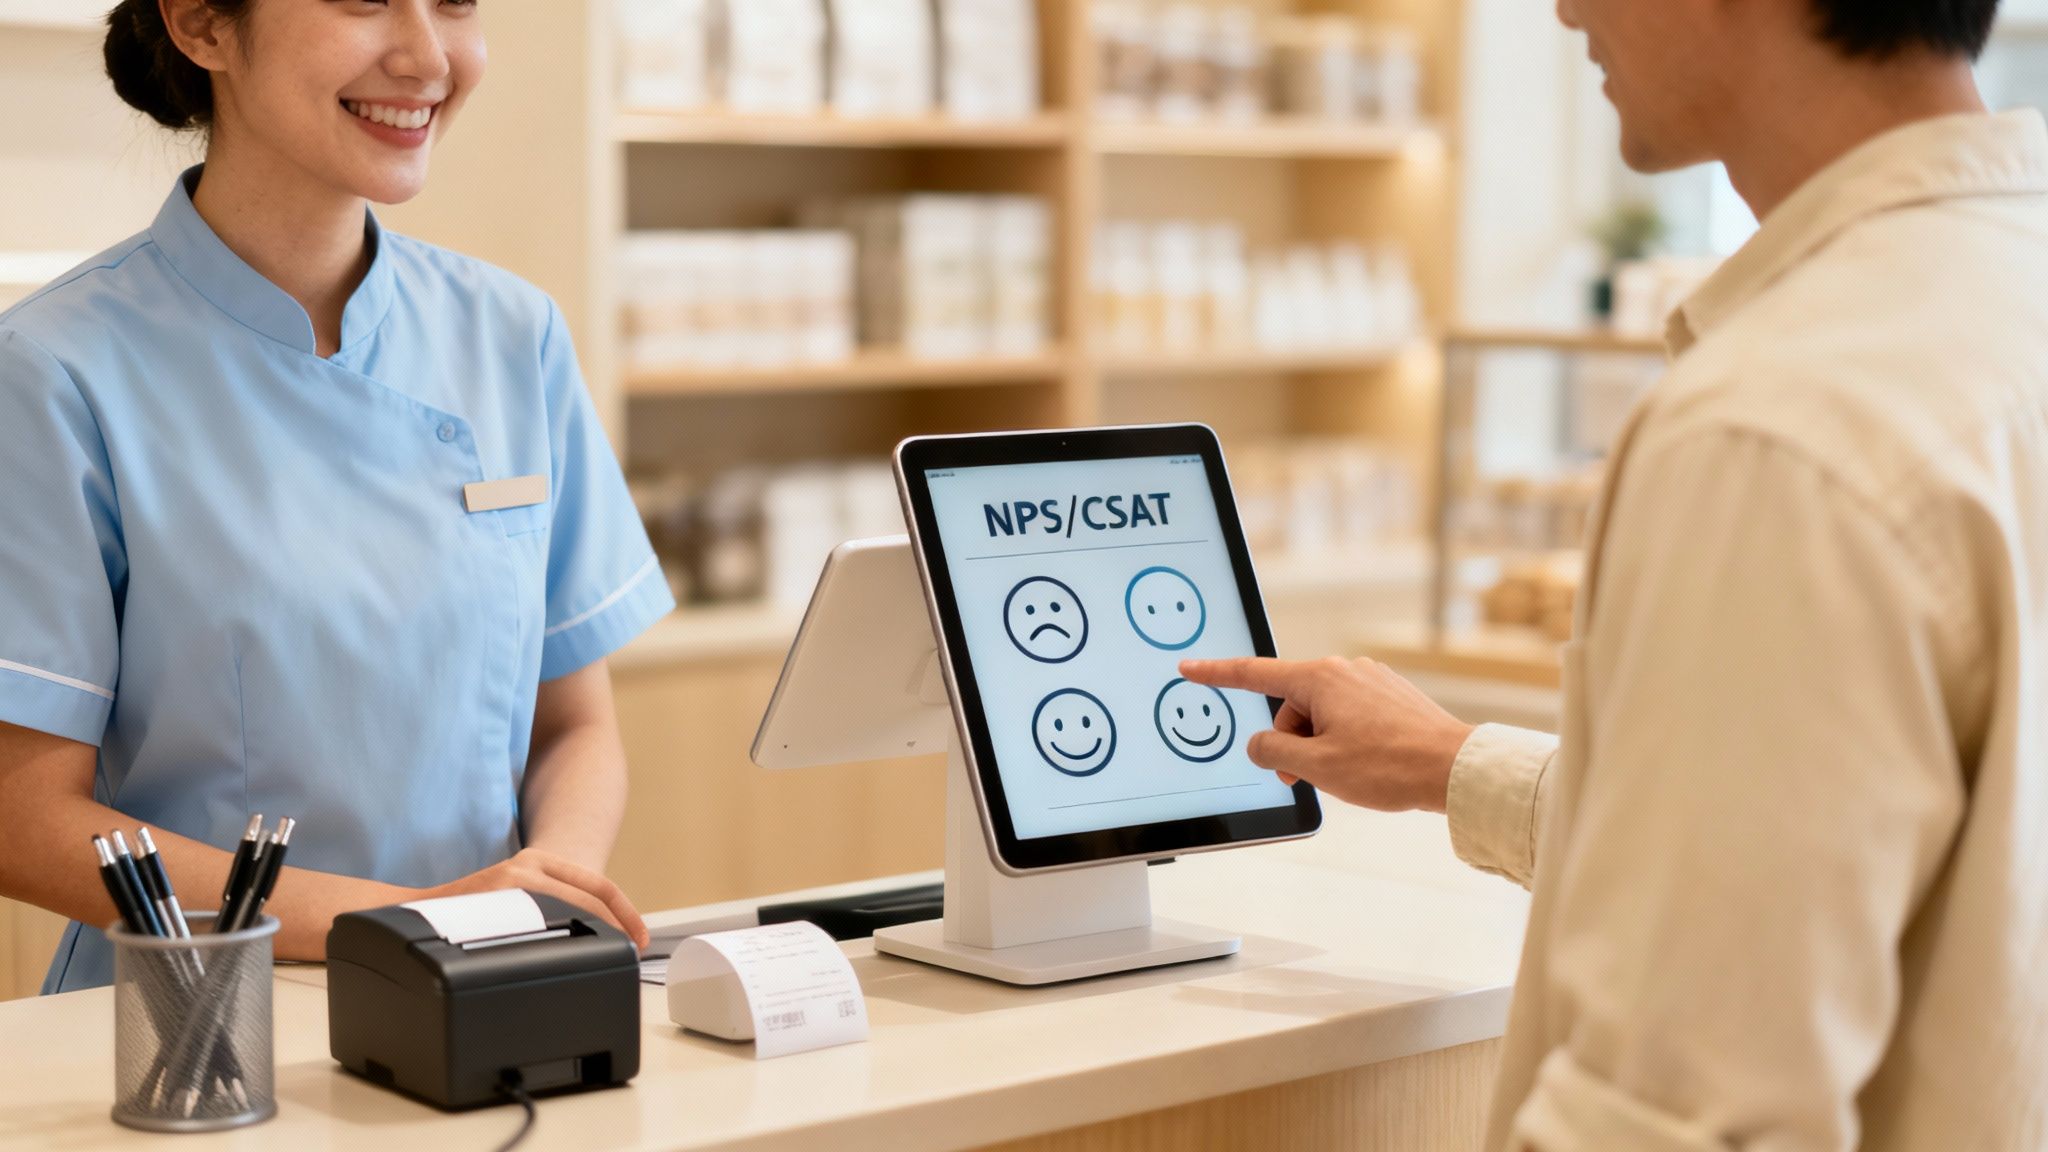
Knowing if your customers are happy isn’t just a nice thought—it’s a business necessity. Two of the most important KPIs for this are Customer Satisfaction (CSAT) and Net Promoter Score (NPS). They give you a structured way to stop guessing and start measuring what your customers think.
Both CSAT and NPS are built on survey data, which you can gather through email, in-store kiosks, or a link on a receipt. The goal is to get direct feedback to see what you’re doing right and where you can get better. The real magic is turning that feedback into action.
- Customer Satisfaction (CSAT): This metric usually comes from a question like, “How would you rate your overall satisfaction with your experience today?” Customers respond on a scale (like 1-5), and a high average score points to a positive experience.
- Net Promoter Score (NPS): This one measures long-term loyalty by asking, “How likely are you to recommend our store to a friend or colleague?” on a scale of 0-10. Based on their answers, customers are sorted into three groups: Promoters (9-10), Passives (7-8), and Detractors (0-6). Your NPS is the percentage of Promoters minus the percentage of Detractors.
This table breaks down how these customer-centric KPIs compare.
Customer-Centric KPIs Breakdown
| KPI | Primary Goal | Data Collection Method |
|---|---|---|
| Conversion Rate | Measures in-store sales effectiveness | POS transaction data and foot traffic counters |
| Customer Satisfaction (CSAT) | Gauges happiness with a specific interaction | Post-purchase surveys (email, kiosk, receipt) |
| Net Promoter Score (NPS) | Assesses overall brand loyalty | Targeted customer surveys via email or app |
Each of these metrics gives you a different piece of the puzzle, helping you build a complete picture of your relationship with your customers.
Why Industry Benchmarks Matter
Here’s something important to remember: customer satisfaction levels aren’t the same across the board. The 2025 Retail CX Insights Report from HappyOrNot shows that global in-store satisfaction averages 91.8%, but that number changes depending on the industry.
For example, pharmacies hit a satisfaction rate of 96.7%, while fashion and apparel stores are at 81.8%. This is why you have to compare your performance against relevant industry benchmarks—customer expectations are different everywhere.
Understanding these differences helps you set realistic goals. A clothing boutique shouldn’t be chasing the same CSAT score as a pharmacy because the customer journey is different. Ultimately, a focus on the customer experience is essential when choosing a software provider because your tools have to support the service goals you’ve set for your business. By digging into these KPIs, you gain the knowledge to fine-tune your operations and build stronger relationships with the people who matter most.
Putting Your KPIs into Action
Knowing your numbers is one thing, but the magic happens when you use that data to make decisions. KPIs aren’t just for spreadsheets and reports; think of them as diagnostic tools that tell you what’s working—and what’s not—inside your business.
This is where the data you collect connects to the strategies you run. Your KPI dashboard is like a map. It shows you where you are, but you still have to decide which road to take. By digging into your metrics, you can build targeted action plans that move the needle.
Translating Data into Business Decisions
When a KPI starts trending in the wrong direction, it’s a red light telling you to pay attention. The trick is to ask “why?” and then figure out the response. Each metric shines a spotlight on a different part of your operation, helping you focus your energy where it counts.
For instance, a drop in Sales per Square Foot in a specific corner of your store is a clue. The number itself doesn’t solve the problem, but it tells you where to start digging.
Here are a couple of scenarios and how you might tackle them:
- Low Sales per Square Foot: If one section of your store is underperforming, it could be anything from product placement to lighting. Maybe it’s time to remerchandise the area, add signage, or move a bestseller over there to draw more traffic. It could also be a sign that your staff needs more training on the products in that zone.
- Low Average Transaction Value (ATV): Let’s say your Conversion Rate is high, but your ATV is stuck in low gear. This means people are buying, but they aren’t spending much. That’s an opportunity for upselling and cross-selling. You can train your team to suggest complementary items at checkout or create bundled deals that offer more value.
A Case Study in Actionable Insights
Imagine a mid-sized clothing store that launched a campaign for its new spring collection. The ads worked, driving foot traffic up by 20% compared to the previous month. On the surface, it looked like a success.
But a look at their KPI dashboard told a different story. While more people were walking in, the overall Conversion Rate had dropped from 15% to 10%. The new visitors were curious, but they weren’t buying. The data showed that while the marketing message got them in the door, the in-store experience was failing to seal the deal.
This gap between traffic and sales is a common challenge. It demonstrates that KPIs must be viewed together to get a complete picture. A single metric in isolation can be misleading.
Armed with this insight, the retailer shifted gears. Instead of pouring more money into ads, they focused on what was happening inside the store. They retrained their staff on the new collection’s selling points, redesigned product displays to be more engaging, and made sure the fitting rooms were easy to find and use.
Within a month, their Conversion Rate climbed back up to 14%, finally turning that extra foot traffic into revenue.
The Central Role of Conversion Rate
If there’s one KPI to obsess over, it’s Conversion Rate. It measures the percentage of visitors who make a purchase, giving you a clear picture of how effective your sales strategies and store experience are. For a brick-and-mortar store, you calculate it by dividing total transactions by total store traffic. For e-commerce, it’s transactions over unique visitors.
This is the metric that turns foot traffic into money. Sometimes, improving your conversion rate can have a bigger impact on your bottom line than just getting more people in the door. Industry experts often suggest focusing on conversion rate right alongside ATV and foot traffic to get the best results. You can find more insights on retail performance indicators on Theoryhouse.com.
At the end of the day, your KPIs create a feedback loop. They show you the results of what you’re doing right now, giving you the information you need to make adjustments. This cycle of measuring, analyzing, and acting is what turns data from a report into your most powerful tool for building a stronger, more profitable business.
Implementing a KPI Tracking System
Knowing which retail KPIs matter is one thing. Building a reliable system to track them is where the real work begins. This is how you turn abstract numbers into a tool that helps you run your business, moving from theory to day-to-day practice.
The goal isn’t to get lost tracking every metric under the sun. It’s about being selective and focusing on the KPIs that align with your business goals and give you information you can act on.
Selecting the Right KPIs for Your Business
No two retail businesses are identical, and your KPIs should reflect that. A high-end fashion boutique is going to care about different numbers than the local hardware store. The trick is to pick indicators that directly measure how you’re progressing toward your goals, whether that’s building customer loyalty, tightening up your inventory, or boosting profits.
A good place to start is by asking yourself what your biggest business questions are. Worried about foot traffic? Is inventory gathering dust on your shelves? The answers will point you to the most relevant KPIs, like Conversion Rate or Inventory Turnover. This keeps you from drowning in data and helps your team stay focused on what matters.
Choosing the right KPIs is like a chef selecting ingredients. You don’t need every spice in the kitchen for every dish; you need the specific ones that create the desired flavor. A focused set of metrics will provide clarity, not confusion.
Gathering Data with the Right Tools
Once you know what to measure, you need the right tools to collect the data. Modern retail runs on integrated systems that capture information automatically, which cuts down on human error and saves time. Without them, tracking KPIs becomes a messy, inaccurate chore.
The hub for all this data is usually your Point of Sale (POS) system. A modern POS is more than a cash register; it automatically logs the data for KPIs like Average Transaction Value (ATV), sales per hour, and units per transaction. All that information is captured in real-time with every sale.
And for your biggest asset—your inventory—you need inventory management software. This software tracks stock levels, how fast items are selling, and supplier lead times, giving you the raw data needed to calculate Inventory Turnover and Sell-Through Rate. When this is tied into your POS, you get a unified view of your entire operation. It’s why so many businesses are ready to ditch the spreadsheets for something that does the heavy lifting for them.
Visualizing Data Through Dashboards
Let’s be honest, raw numbers in a spreadsheet are hard to make sense of. Data visualization is what turns those numbers into charts and graphs that you can understand in a second. A KPI dashboard is a screen that pulls all your most important metrics into one place, making it easy to spot trends, anomalies, and opportunities at a glance.
A well-designed dashboard is like the command center for your business. For example, seeing a line chart of a declining Conversion Rate over several weeks hits a lot harder than a column of numbers. This visual approach helps you and your team grasp what’s happening quickly so you can make decisions, faster.
This simple workflow shows how data gets translated into action.
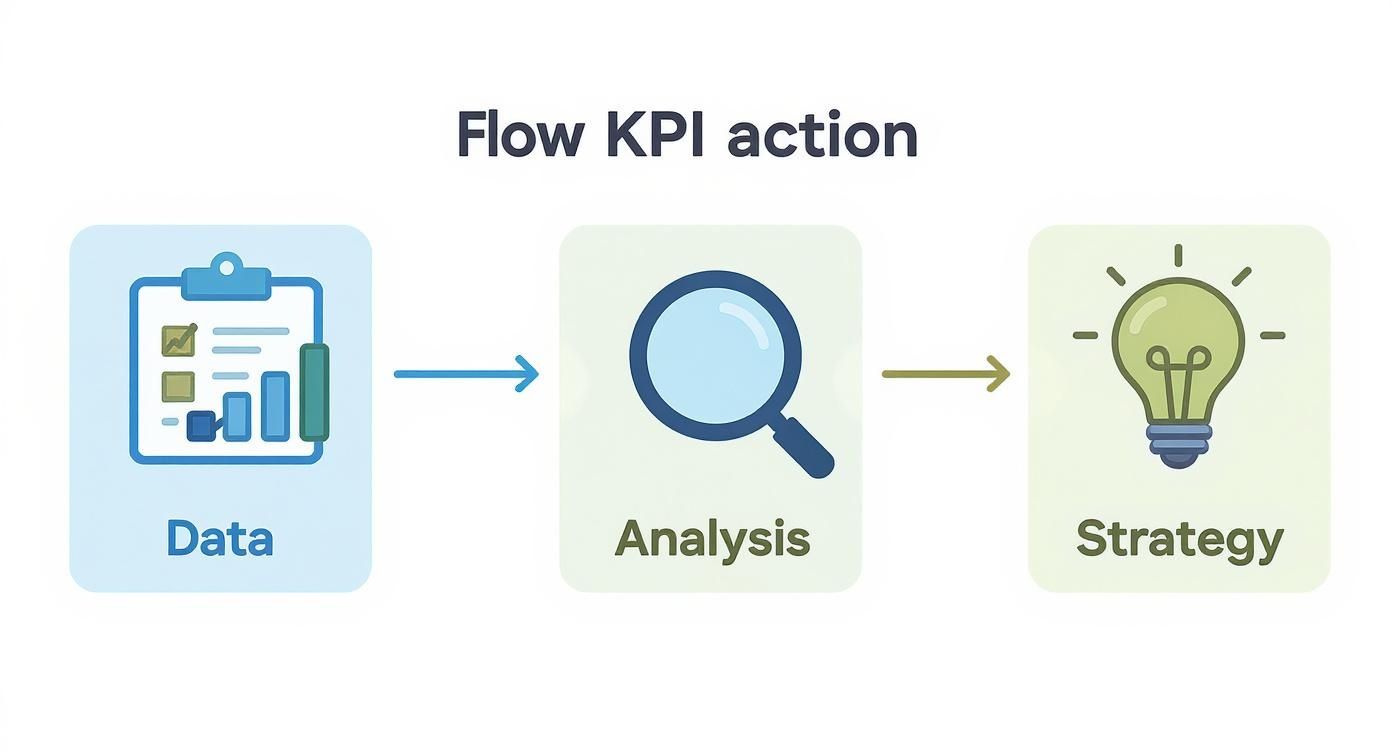
This flow from data collection to real strategy is all about creating a cycle of continuous improvement.
This whole process ensures your retail KPIs aren’t just stale reports but are actively driving your business forward. From picking the right metrics to seeing them on a dashboard, every step is about giving you clarity and empowering you to make better calls. The final piece is getting into a routine of reviewing these KPIs and turning those insights into concrete actions that make your store better. That cycle of analysis and adaptation is what separates the successful retailers from everyone else.
Got Questions About Retail KPIs? We’ve Got Answers.
When you first start digging into performance metrics, a lot of the same questions tend to pop up. Let’s tackle some of the most common ones retailers ask, so you can move forward with confidence.
As a Small Retailer, Which KPIs Should I Track First?
It’s easy to get lost in a sea of data. If you’re a small business, the key is to avoid analysis paralysis and focus on a handful of metrics that tell you the most about your business’s health.
I always recommend starting with these three:
- Conversion Rate: This tells you how good you are at turning browsers into buyers. It’s the single best measure of your in-store or online sales effectiveness.
- Average Transaction Value (ATV): This one’s simple: how much does the average customer spend in a single purchase? Bumping this number up is one of the fastest ways to increase revenue.
- Inventory Turnover: This shows how quickly you’re selling through your stock. It’s crucial for making sure your cash isn’t just sitting on a shelf collecting dust in the form of slow-moving products.
Nailing these three gives you a solid foundation. You’ll get a clear, actionable picture of your sales, customer spending habits, and inventory health without needing a complex data setup.
The biggest mistake I see new retailers make is trying to track everything at once. Focus on the vital few that are directly tied to your revenue and cash flow. Those are the metrics that will actually help you make smart decisions for your growing business.
How Often Should I Be Looking at My KPIs?
Good question. The answer is: it depends. Not every metric needs to be checked every day. You’d drive yourself crazy.
A rule of thumb is to match your review schedule to how quickly you can (or should) act on the information. It’s about creating a rhythm, not just staring at numbers.
Here’s a practical cadence to consider:
- Daily or Weekly: This is for your operational pulse-check. Metrics like total sales, conversion rates, and ATV fall into this bucket. Checking them frequently helps you spot a good sales day or a sudden dip that needs immediate attention.
- Weekly or Monthly: Think more tactical here. KPIs like sell-through rates for a specific brand or product category are perfect for a weekly or monthly review. This is the data that informs your next promotion or reorder.
- Monthly or Quarterly: Now you’re looking at the big picture. Strategic KPIs like Customer Lifetime Value (CLV) and your overall Inventory Turnover rate are best viewed over a longer timeframe. These tell the story of your business’s long-term health and growth trends.
Can I Track KPIs Without Spending a Ton on Software?
Absolutely. Don’t let a tight budget stop you from measuring what matters. While dedicated software like Pomodo automates a lot of this, you can get started with tools you probably already have.
Most modern Point of Sale (POS) systems, for example, come with built-in reporting. You can usually pull data for total sales, transaction counts, and ATV right out of the box. For something like inventory turnover, a simple spreadsheet is all you need to plug in the numbers and do the math. Need customer feedback? Free tools like Google Forms can help you collect satisfaction scores and testimonials.
Starting small and manual is infinitely better than not tracking anything at all.