A kpi for retail is a measurable value that shows how a business is hitting its goals. These numbers go beyond daily sales. They give you the story on the health of your shop—from how quickly inventory is moving to how many customers return.
Tracking the right KPIs gives you a picture of what’s working and what needs help.
Understanding Key Performance Indicators for Retail
Imagine your retail business is a car on a road trip. Your destination? Growth and profitability. Your speedometer (total sales) is useful for telling you how fast you’re going, but that’s about it. It won’t tell you if you have enough gas, if the engine is overheating, or if you’re on the right highway.
This is where Key Performance Indicators (KPIs) come in. Think of them as your car’s dashboard. KPIs are your navigation system, giving you the info you need to make decisions. They show you your fuel level (inventory turnover), engine health (profit margins), and if your passengers are happy (customer retention rate). Without them, you’re driving blind.
A modern POS system pulls all this together, giving you a dashboard to monitor these signs in real-time.
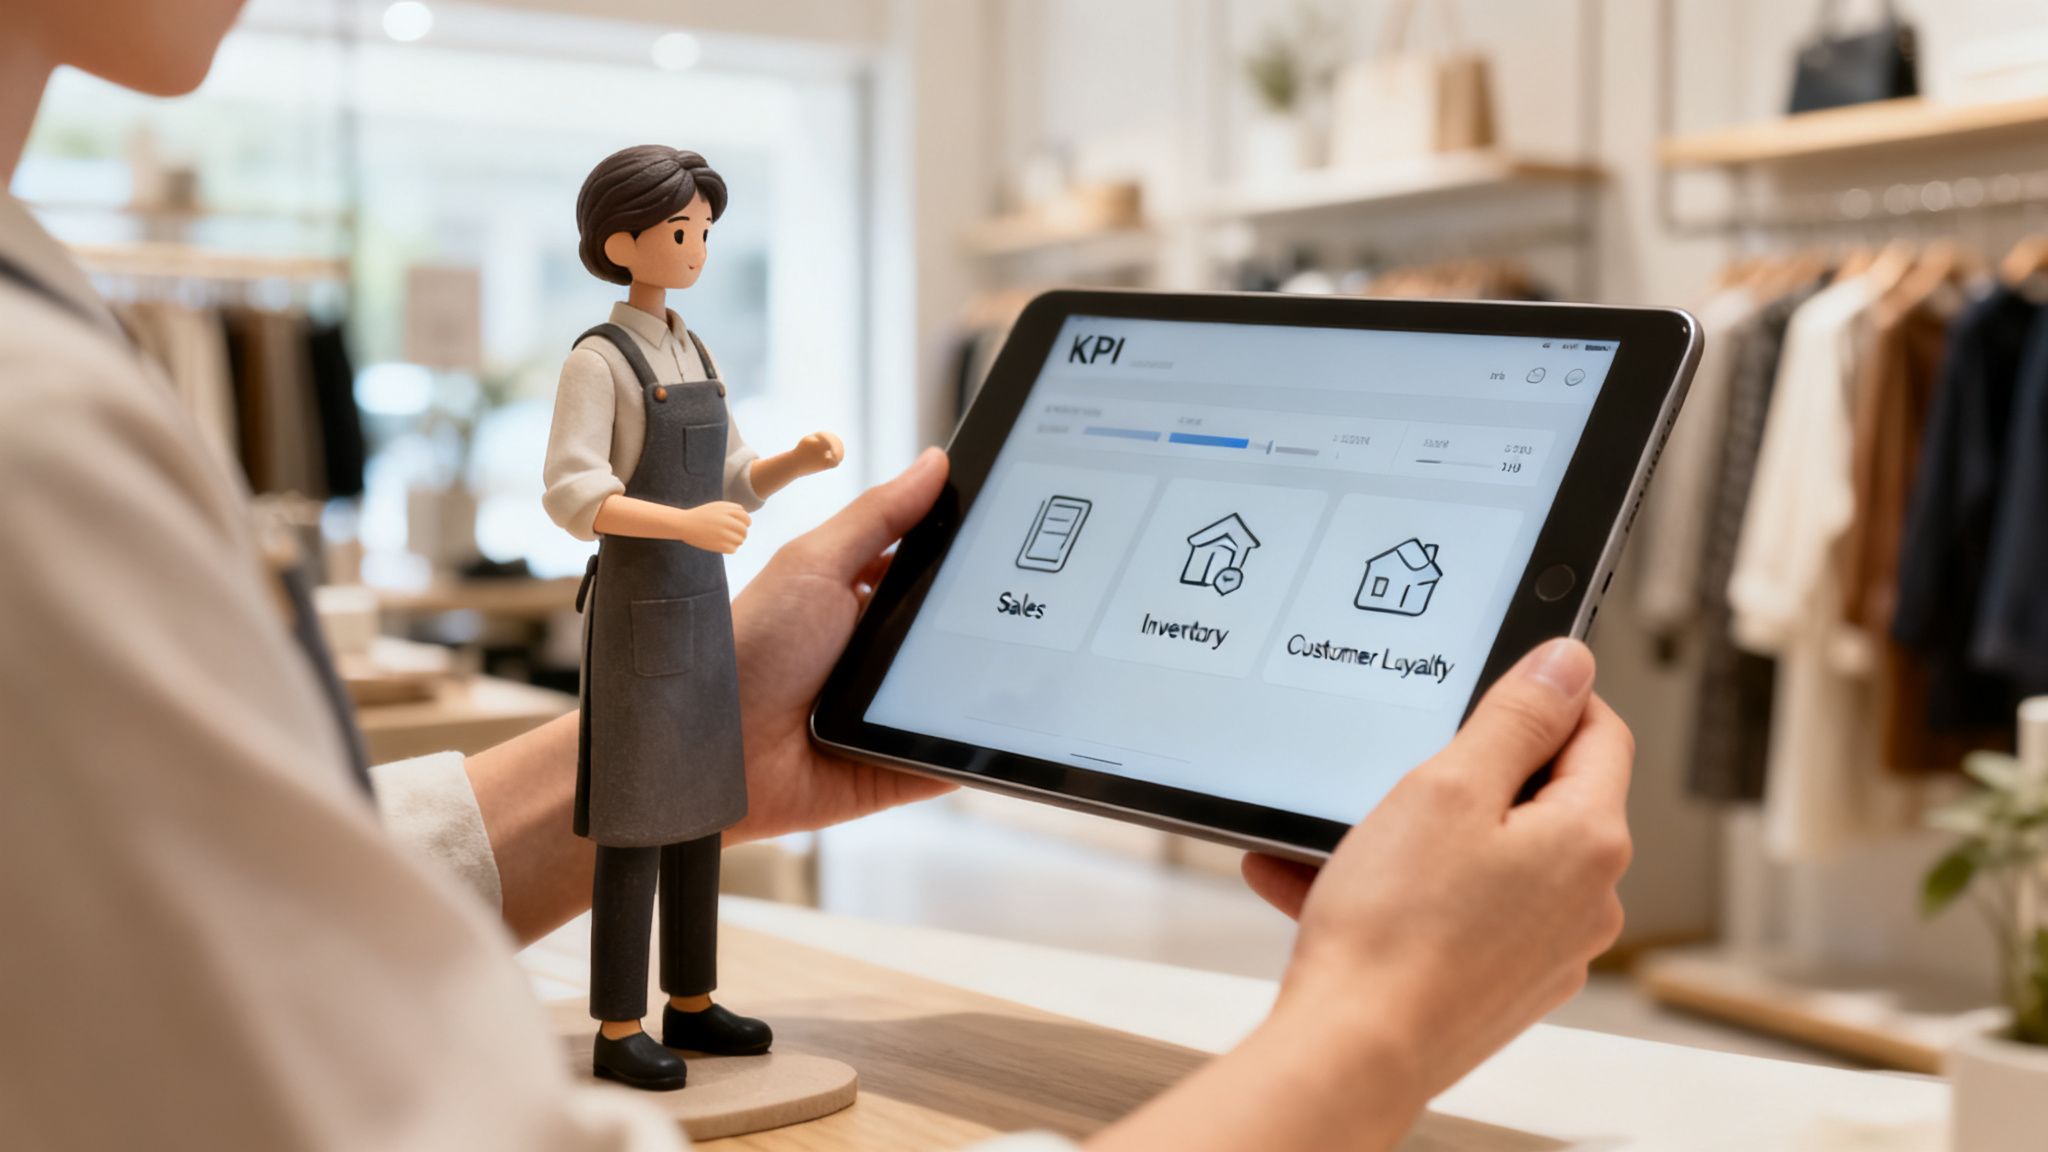
This kind of at-a-glance report shows you how you’re doing across sales, inventory, and customer loyalty, making analysis simple.
The Purpose of a KPI for Retail
The main job of a KPI is to turn data into an actionable insight. Instead of staring at a spreadsheet of transactions, a KPI boils information down into a single number. This helps you answer the questions that determine your success.
You’ll get answers to questions like:
- Are we pricing our products to make a profit?
- Is our inventory selling fast enough to justify the cash we have tied up in it?
- Do our customers like us enough to come back?
- Is our physical store space generating enough revenue to cover the rent?
A KPI isn’t just a metric; it’s a communication tool. It simplifies business performance into a number that everyone on your team can understand and work to improve.
By focusing on a handful of the right KPIs, you create a shared understanding of what you’re aiming for. It doesn’t matter if you run a pet store or a multi-location chain of beer distributors—these indicators guide your strategy and steer the business. The goal is to stop putting out fires and start making proactive, data-driven decisions.
2. Core Sales and Profitability KPIs
To get a feel for your store’s health, you have to start with the money. These sales and profitability KPIs are a report card for your revenue and efficiency. They cut to the chase, answering the questions: How much are you making on each sale, and how well is your business turning products into cash?
These aren’t just abstract numbers. They’re direct feedback on your pricing strategy, your product mix, and how effective your sales team is. Modern POS reporting features do the heavy lifting for you, calculating these metrics automatically and saving you from manual spreadsheets and the risk of human error.
To give you an overview, here’s a table summarizing the financial metrics we’ll be covering.
Key Sales and Profitability KPIs at a Glance
This table breaks down the financial KPIs, showing you how to calculate them and what they tell you about your business’s performance.
| KPI Name | Formula | What It Measures |
|---|---|---|
| Gross Profit Margin | ((Total Revenue – COGS) / Total Revenue) x 100 | The profitability of your products before operating expenses. |
| Average Transaction Value | Total Revenue / Number of Transactions | The average amount a customer spends in a single purchase. |
| Sales Per Square Foot | Total Revenue / Total Selling Area (in square feet) | The revenue-generating efficiency of your physical retail space. |
These metrics provide a foundation for understanding your store’s financial pulse. Let’s dig into each one.
Gross Profit Margin
First up is Gross Profit Margin, a foundational KPI for any retail business. It tells you how profitable your products are by measuring the percentage of revenue left after you’ve paid for the goods themselves—what’s known as the Cost of Goods Sold (COGS). A higher margin is better because it means you’re keeping more money from every sale.
The formula is straightforward:
Gross Profit Margin = ((Total Revenue – COGS) / Total Revenue) x 100
Let’s make this real. Say a pet store brings in $10,000 in revenue. If the dog food, toys, and leashes it sold cost the store $6,000, the gross profit is $4,000. That gives them a Gross Profit Margin of 40%. This number is powerful because it isolates the profit made on the products, separate from operating costs like rent or payroll.
Keeping an eye on this KPI helps you make decisions about pricing. If your margin is shrinking, it might be time to negotiate with your suppliers or adjust your prices. With a system like Pomodo’s reporting dashboard, you can see the margin for every product, category, or your entire store, giving you the data you need to boost profitability.
Average Transaction Value
Another number to watch is your Average Transaction Value (ATV), which you might also hear called Average Order Value (AOV). This KPI is simple: it measures the average amount a customer spends in a single transaction. It’s a window into your customers’ spending habits.
Here’s how you calculate it:
Average Transaction Value = Total Revenue / Number of Transactions
Imagine your store made $5,000 from 100 sales. Your ATV would be $50. When you see your ATV starting to climb, it’s a good sign—it means customers are either buying more items or choosing more expensive ones each time they visit.
Monitoring ATV is the way to see if your upselling and cross-selling efforts are paying off. A beer distributor, for example, could start training staff to suggest chips or pretzels with certain craft beers. If ATV spikes after that training, you know the strategy is a winner. By tracking ATV in your POS, you can test sales tactics and see what works to get customers to spend more.
Sales Per Square Foot
For anyone running a brick-and-mortar store, your physical space is one of your biggest investments. Sales Per Square Foot is the metric that tells you how efficiently you’re using that space to generate revenue. It’s an indicator of how well your store layout and product placement are working.
The formula is simple:
Sales Per Square Foot = Total Revenue / Total Selling Area (in square feet)
A note: this calculation should only include the floor space used for selling products. Your stockroom, office, and bathrooms don’t count. So, if a fireworks store with 1,000 square feet of retail space generates $100,000 in a month, its Sales Per Square Foot is $100.
This KPI is your weapon for finding underperforming spots in your store. Once you know which areas are lagging, you can start making changes—rearranging displays, giving high-margin products a more prominent spot, or rethinking your product mix to make every square foot pull its weight.
Mastering Inventory Management KPIs
Beyond what you sell, what you don’t sell matters just as much. Your inventory is the biggest asset your retail business holds, and it’s best to think of it as cash on your shelves. Like the cash in your register, you need that inventory to flow efficiently to keep your business healthy. Inventory management KPIs are the tools that measure that flow, helping you turn products into profit without tying up all your capital in slow-moving stock.
Keeping an eye on these numbers is non-negotiable. They tell you which items are flying off the shelves and which are collecting dust. This is how you make data-backed decisions that cut holding costs, prevent stockouts of your bestsellers, and make your store more profitable.
The relationship between your retail metrics is woven. Things like margin, transaction value, and sales per square foot all feed into each other to drive your performance.
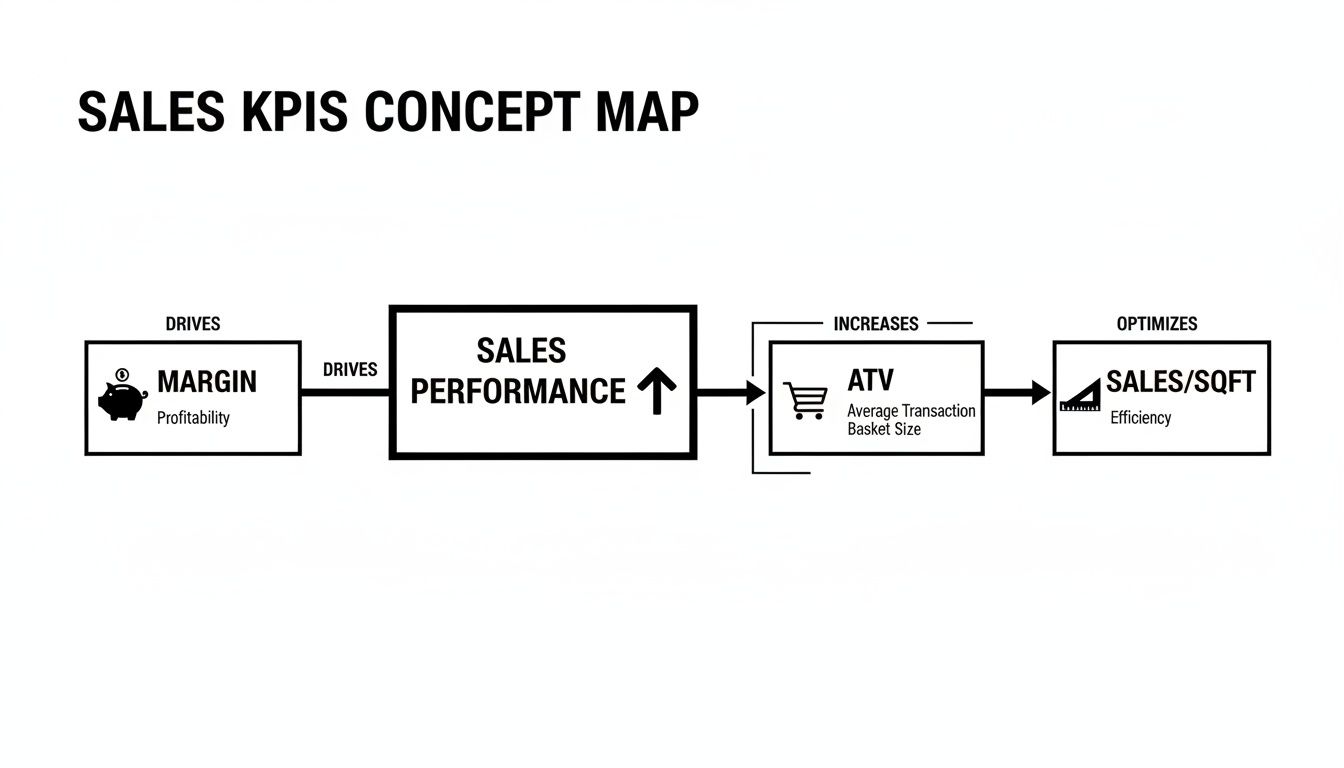
As you can see, a healthy product margin has a direct effect on what customers spend and how effectively you’re using your retail space.
Inventory Turnover Ratio
One of the most important inventory metrics is the Inventory Turnover Ratio. This KPI tells you how many times you sold and replaced your stock over a period. A higher number is good—it means strong sales and efficient management. A low number? That’s a red flag that your stock is sitting for too long.
The calculation is straightforward:
Inventory Turnover Ratio = Cost of Goods Sold / Average Inventory
Let’s say a beer distributor has a Cost of Goods Sold (COGS) of $200,000 for the year, and their average inventory was valued at $25,000. Their turnover ratio is 8, meaning they sold through their inventory eight times that year. In the world of retail, the top performers hit a turnover of 8-12 times a year, restocking their store every 30-45 days.
Slow turnover is a killer because it ties up capital. Imagine having $100,000 in unsold fireworks sitting in a warehouse during the off-season—storage costs can chew away 20-30% of your margins. On the flip side, high turnover, which you can boost with tools like real-time cycle counts and multi-location transfers, can slash holding costs by 15-25%. That’s how you turn a potential loss into growth.
Sell-Through Rate
While turnover gives you the 30,000-foot view, Sell-Through Rate gets down to individual products. It calculates the percentage of units you sold compared to the total you received from a supplier. This metric is perfect for figuring out if a new product line or a promotion was a hit or a miss.
Here’s the formula:
Sell-Through Rate = (Units Sold / Units Received) x 100
If a pet store brings in 200 bags of a new dog food brand and sells 150 of them in the first month, that’s a 75% sell-through rate. It confirms the product is a winner with customers. But if that rate is low, it’s a signal to mark the item down and clear the space for something that moves.
Gross Margin Return on Investment
Finally, we have Gross Margin Return on Investment (GMROI), which connects your inventory to your bottom line. It answers a question: “For every dollar I put into inventory, how much gross margin am I getting back?” GMROI is a KPI because it forces you to balance sales volume with profitability.
The formula looks like this:
GMROI = Gross Margin / Average Inventory Cost
Any GMROI over 1 means you’re making money on that inventory. For example, if your gross margin is $50,000 and your average inventory cost is $20,000, your GMROI is 2.5. You’re earning $2.50 for every $1 invested in stock. Now that’s a healthy return.
By tracking GMROI, retailers can pinpoint products that aren’t just selling well but are also profitable. This leads to smarter purchasing decisions and ensures shelf space is reserved for items that give you the best financial return.
Modern systems have tools like automated purchase orders and cycle counts that are designed to improve these inventory KPIs. They help ensure you have enough of what sells and not too much of what doesn’t. You can see how these tools work by checking out our guide on POS inventory management features.
Measuring Customer Loyalty and Engagement
Sales and inventory numbers give you a view of what’s selling, but they don’t tell you the whole story. To build a business that lasts, you have to look beyond the products and understand why people choose to buy from you. This is where we get into the KPIs that measure the strength of your customer relationships—the key to turning one-time buyers into regulars.
Think of it this way: a single sale is good, but a customer who keeps coming back is gold. These metrics help you see how well you’re building those connections and measure the long-term value of your customer base.
Customer Retention Rate
First up is the Customer Retention Rate (CRR). This KPI is about loyalty. It measures the percentage of your existing customers who stick with you and make repeat purchases over a set period. It’s a reflection of how happy people are with your brand.
Here’s the formula to figure it out:
Customer Retention Rate = ((Ending Customers – New Customers) / Starting Customers) x 100
Let’s break that down. Say a local pet store starts the quarter with 500 customers. By the end of the quarter, they have 450 total customers, but they know 50 of those are new. That means they kept 400 of their original shoppers. Plug that into the formula, and you get an 80% retention rate. A high CRR is a sign that your products and service are hitting the mark. Want to dive deeper? Check out our guide on how loyalty programs keep pet store customers coming back.
Customer Lifetime Value
Next, we have Customer Lifetime Value (CLV). This metric shifts your focus from a single purchase to the entire relationship you have with a customer. It projects the total amount of money you can expect to earn from one person over their time shopping with you.
A way to calculate CLV is by combining a few other metrics:
Customer Lifetime Value = Average Transaction Value x Average Number of Transactions x Average Customer Lifespan
Imagine a regular at a bottle shop who spends about $60 every time they visit. They stop in 12 times a year and have been a customer for 5 years. That person’s CLV is $3,600. When you know that number, it’s easier to justify spending a little extra on a loyalty program or customer service, because you can see the long-term payoff.
Customer Retention has become a focus for retailers. The best in the business hit 65-80% retention, crushing the industry average of 45-55%. Why does it matter so much? Because retained customers spend 67% more over time. For businesses like beer distributors tracking purchase history or pet stores that thrive on repeat visits, losing customers is a problem. Acquiring a new customer can cost anywhere from 5 to 25 times more than keeping an existing one. You can find more insights on these retail benchmarks from HappyOrNot.
Foot Traffic
For any brick-and-mortar store, Foot Traffic is one of the most fundamental KPIs. It’s the number of people who walk through your doors. Not every visitor will buy something, but you can’t make a sale if they never come inside. High foot traffic is the first step to creating more sales opportunities.
There’s no formula here—it’s just a count. You can track this daily, weekly, or monthly to pinpoint your busiest times. Compare your foot traffic to your number of transactions. That gives you your conversion rate, which shows you how good your team is at turning browsers into buyers.
Think about a fireworks retailer. They know they’re going to see a spike in foot traffic in the days leading up to a holiday. By watching this data, they can make sure they have enough staff on the floor to handle the rush and give every customer a good experience, maximizing their sales when it counts.
Applying KPIs in Specialty Retail
Knowing the theory behind KPIs is one thing, but seeing them work in the real world is where it all clicks. The metrics that matter most depend on what you sell and how you sell it. A high-volume beer distributor, a seasonal fireworks shop, and a neighborhood pet store have different challenges and goals.
These examples show how a specific kpi for retail can be the most important number for one business but a secondary concern for another. Understanding this context is the key to figuring out which numbers will give you the sharpest insights for your own store.
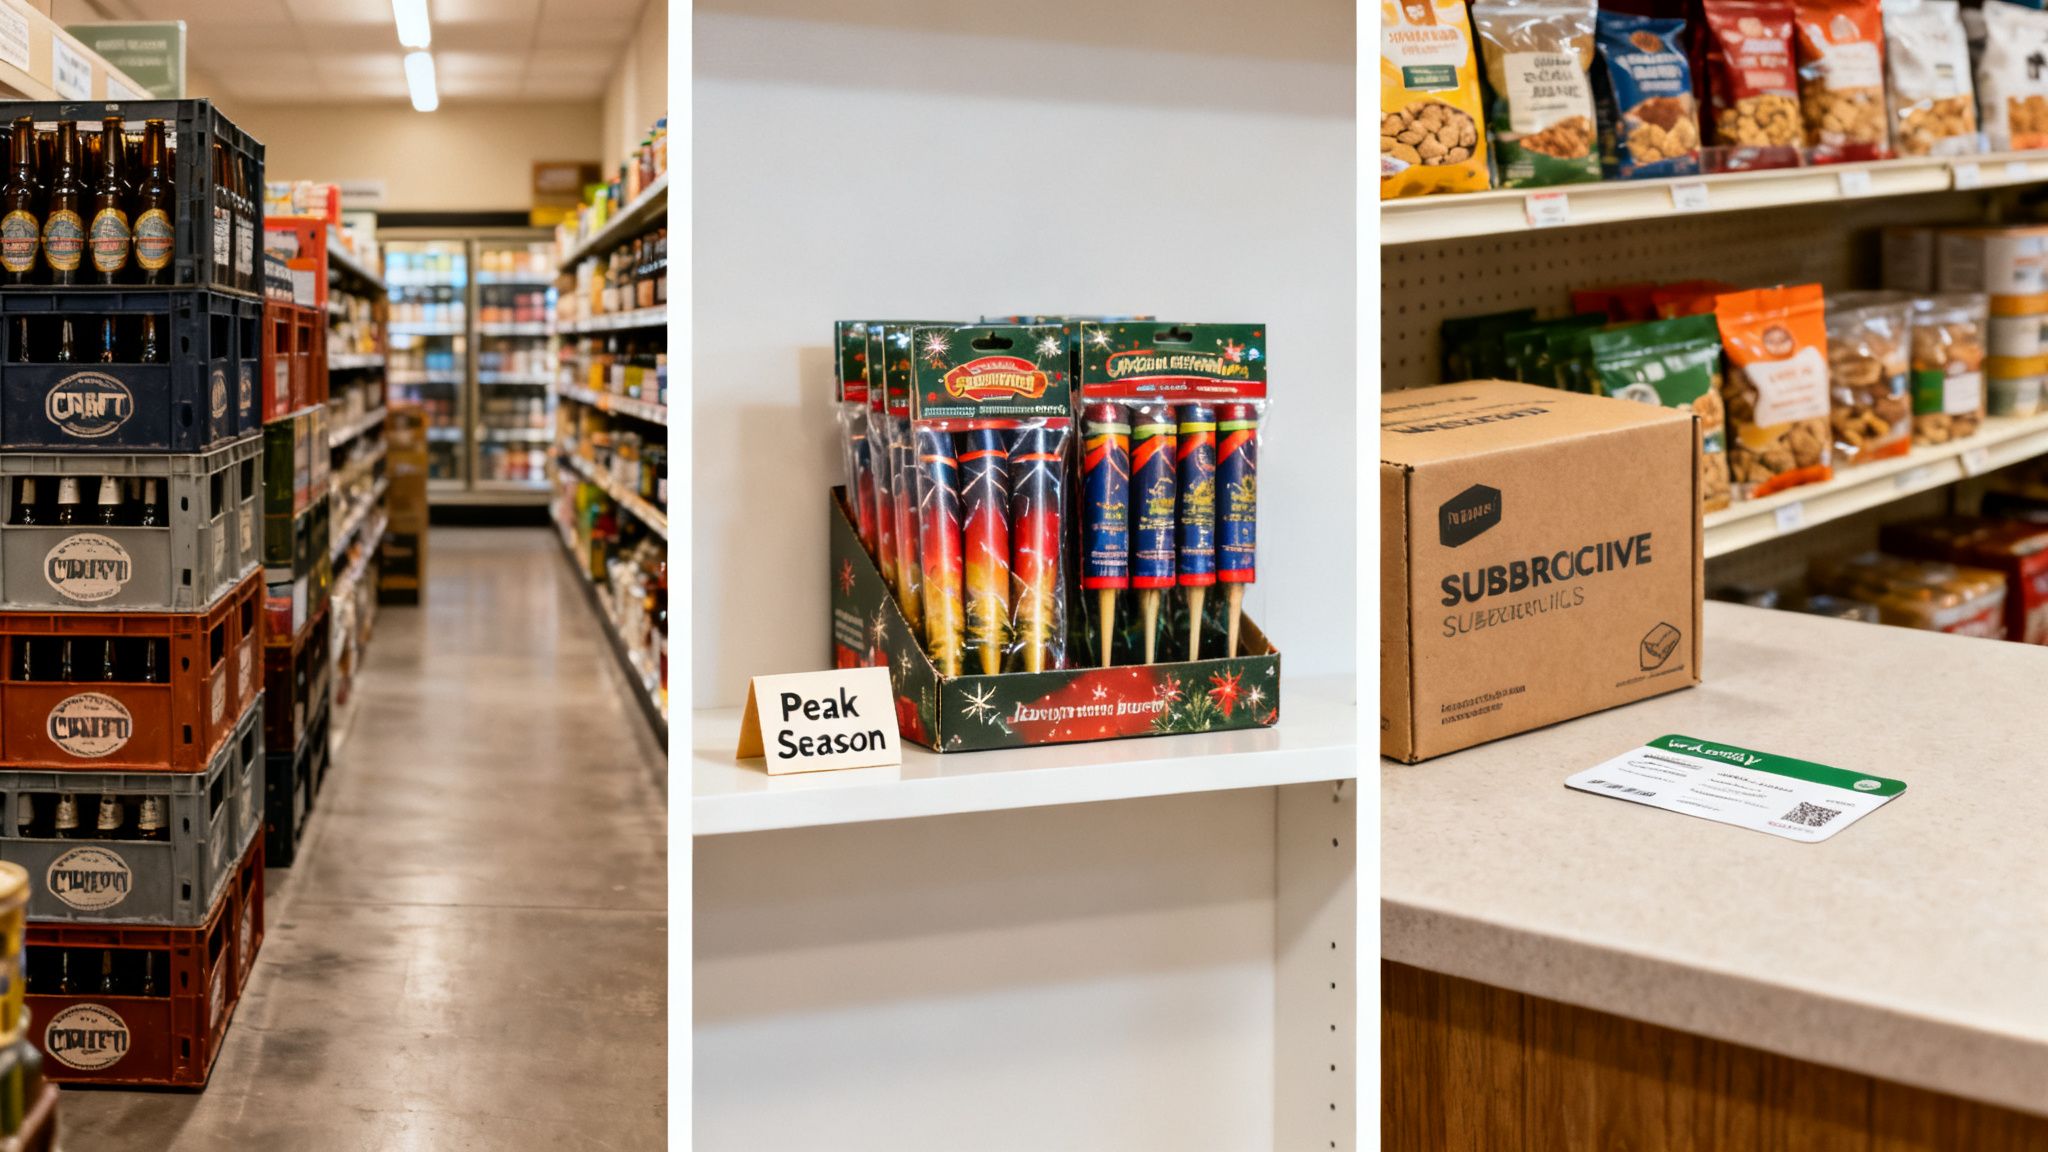
Beer Distributor Inventory Turnover
For a beer distributor, inventory isn’t just an asset—it’s a perishable one. Freshness is everything, especially for sought-after craft IPAs. This makes the Inventory Turnover Ratio the single most important number to watch.
A distributor uses their POS system to track turnover not just for the warehouse, but for specific styles. They might discover their hazy IPAs are flying off the shelves, turning over 12 times per year, while darker stouts are moving slower, turning over only 4 times.
This insight drives their purchasing decisions. They can order larger, more frequent shipments of the fast-moving IPAs to avoid stockouts, while scaling back on the stouts to prevent spoilage. Just by tracking one KPI, they prevent lost revenue from expired products and free up cash.
By focusing on Inventory Turnover, the distributor moves from reactive ordering to a proactive strategy. This keeps shelves stocked with fresh, in-demand products, building trust with breweries and retail customers.
Fireworks Store Seasonal Performance
Fireworks retailers live in a world of boom-and-bust. The majority of their revenue comes in around a few holidays. For them, squeezing every drop of profit from their physical space during those short windows is the name of the game. That’s why Sales Per Square Foot is their make-or-break KPI.
During the late June rush, a store manager can track this metric daily. If a display of low-cost novelties is only pulling in $50 per square foot while an endcap of high-margin artillery shells is generating $300 per square foot, the next move is obvious.
They can shrink the novelty section to expand the shell display, making every inch of the store work harder. At the same time, they’re watching the Sell-Through Rate on premium items. If a new $200 multi-shot firework has a 90% sell-through in the first week, they know they’ve got a hot seller and can plaster it all over their marketing.
Pet Store Customer Retention
A local pet store’s success is built on relationships and repeat business. Pet owners need food, treats, and supplies on a regular schedule, which makes Customer Retention Rate and Average Transaction Value (ATV) the most critical KPIs.
Imagine the store manager sees their retention rate is solid, but wants to increase what each customer spends. Using customer history data, they can spot regulars who always buy the same brand of dog food.
The store then rolls out a subscription program, offering a 10% discount on food for customers who commit to monthly pickups. This program has two goals: it locks in loyalty and boosts ATV by encouraging shoppers to add a toy or bag of treats to their purchase. By tracking both KPIs, the owner can see if the program isn’t just keeping customers, but making each visit more profitable.
Different retail environments call for different strategic focuses. While every KPI offers value, knowing which ones to prioritize can make or break a specialty business. A beer distributor obsessed with customer loyalty might miss the mark on freshness, while a pet store focused solely on sales per square foot might ignore the lifetime value of their regulars.
The table below breaks down where the focus should be for these retail niches.
KPI Focus for Specialty Retail Niches
| Retail Niche | Primary KPI Focus | Secondary KPI Focus | Relevant Pomodo Feature |
|---|---|---|---|
| Beer Distributor | Inventory Turnover Ratio | Sell-Through Rate | Inventory Management & Sales Reporting |
| Fireworks Store | Sales Per Square Foot | Average Transaction Value | Real-Time Sales Dashboards |
| Pet Store | Customer Retention Rate | Average Transaction Value | Customer Relationship Management (CRM) |
By aligning your primary KPIs with your business model, you can use a system like Pomodo not just to track sales, but to make smarter, more profitable decisions that are suited to your specific corner of the retail world.
Alright, let’s get those numbers working for you. Knowing what KPIs are is one thing, but putting them to use to grow your business is where the magic happens. The good news? You don’t need a data science degree to make this work. It’s a process of picking the right numbers, keeping an eye on them, and then doing something about what they tell you.
This isn’t about tracking every metric under the sun. That’s a way to get overwhelmed. The goal is to use a handful of key data points to make smarter decisions—the kind that lead to tangible results. It’s about shifting from a reactive mindset, where you’re always putting out fires, to proactively steering your business toward growth.
Build Your Initial KPI Dashboard
To start, just pick 3-5 core KPIs that speak to your immediate business goals. If you’re a new shop, you might be focused on Sales Per Square Foot and Average Transaction Value to make sure your store concept is viable. On the other hand, an established retailer might zero in on Inventory Turnover and Customer Retention Rate to squeeze more efficiency out of their operation.
Once you’ve picked your metrics, get them onto a dashboard in your reporting software. This puts all your vital signs in one place, giving you a single picture of your store’s performance. Modern POS systems are good for this, often coming with customizable dashboards that do the heavy lifting for you by pulling real-time data from your sales and inventory records.
A clean, visual dashboard lets you check the pulse of your business at a glance. You can spot trends or flag problems right away without having to dig through reports.
Establish a Review Cadence
Here’s a habit that separates thriving retailers from those just getting by: consistent tracking. Data only becomes powerful when you look at it regularly. Setting a rhythm for reviewing your numbers helps you see patterns, celebrate what’s working, and tackle issues before they snowball.
Set up a review schedule with your team:
- Weekly Review: This is for your fast-movers, like weekly sales, foot traffic, and conversion rates. These check-ins help you make short-term tweaks, like adjusting staff schedules for a busy weekend or changing up a promotional display that isn’t pulling its weight.
- Monthly Review: Time to look at the bigger picture. Dig into the slower-but-critical KPIs like Inventory Turnover, Gross Profit Margin, and Customer Retention. The insights you gather here will shape your larger strategic moves, like your purchasing plans for the next season or where to focus your marketing budget.
Create Action Plans from Data
This is the final, most important step: turning those numbers into action. A KPI is just a number on a screen until you use it to make a decision. If your Average Transaction Value is dipping, it’s time to create a plan to train your staff on upselling. If a certain product’s Sell-Through Rate is low, schedule a markdown to clear it out and make room for something that will sell.
The purpose of tracking a kpi for retail is not just to collect information but to ask a simple question based on the results “What will we do differently next week?”
This cycle of measure, review, and act is what builds momentum. It transforms your POS data from a history of what happened into a roadmap for where you want to go.
For a deeper dive into getting your stock under control, check out our guide on integrated inventory management software.
Answering Your Top Questions About Retail KPIs
When you first start digging into retail KPIs, it’s natural to have a few questions. The goal here isn’t just to throw numbers around, but to build your confidence so you can use this data to manage your business better. Getting answers is the first step.
What’s the Difference Between a Metric and a KPI?
Think of it this way: a metric is about any number you can track. It could be the total number of people who walked into your store today or your total sales revenue for the month. It’s a data point.
A Key Performance Indicator (KPI), on the other hand, is a specific metric you’ve chosen because it’s tied to one of your business goals. It tells you how you’re performing against that objective.
For example, total website visitors is a metric. But the percentage of those visitors who buy something (Conversion Rate) is a KPI. Why? Because it measures how effective your online store is at turning browsers into buyers—a business goal. So, while all KPIs are metrics, not every metric you track will be a KPI.
How Many KPIs Should a Small Business Really Track?
It’s tempting to measure everything, but trying to track dozens of KPIs right out of the gate is a recipe for disaster. You end up with a lot of noise, and it becomes impossible to focus on what moves the needle. For a small retail business, a focused approach is better.
We always tell new business owners to start by tracking between three and five core KPIs. This lets you keep an eye on the most critical parts of your business—like sales, inventory, and customer loyalty—without getting overwhelmed. Once you get comfortable with those, you can start adding more.
How Often Should I Be Looking at My KPIs?
The right review schedule depends on the KPI itself. Some numbers change quickly and need attention, while others give you a better picture when you look at them over a longer period. Setting up a consistent rhythm is key to making sure you act on the information at the right time.
- Weekly: This is for your fast-moving numbers. You’ll want to check things like sales revenue, foot traffic, and average transaction value every week. This helps you spot trends and make quick adjustments.
- Monthly: Use your monthly review for the bigger picture. This is the time to look at indicators like inventory turnover, customer retention, and gross profit margin. These metrics guide your overall strategy for the weeks and months ahead.
This dual cadence gives you the best of both worlds: the short-term insights you need for day-to-day decisions and the long-term perspective required for strategic planning.